FORGE2
Please note that, since the conclusion of the 1000 Genomes Project, FORGE has been updated to FORGE2, which is hosted at the Altius Institute.
FORGE Analysis Tool
The FORGE tool performs Functional element Overlap analysis of the Results of Genome Wide Association Study (GWAS)Experiments, to identify tissue specific signals within the set of GWAS SNPs.
Sections
- Resources
- Overview
- Inputs
- Options
- Outputs
- Output Examples
- Methods
- Source Code
- Citation
- Contact/Acknowledgements
It is now recognised that many of the significant SNPs discovered in GWAS studies lie outside of the exons of protein coding genes, and that many of these hits may overlap regulatory regions within the genome (Maurano et al, 2012, ENCODE Consortium, 2012). The FORGE tool provides a method to view the tissue specific regulatory component of a set of GWAS SNPs.
FORGE analysis takes a set of SNPs, such as those hits above the genome wide significance threshold in a GWAS study, and analyses whether there is enrichment for overlap of putative functional elements compared to matched background SNPs. It assesses enrichment on a per cell type basis since functional elements are differentially active in different cell types, and hence can expose tissue specific signals of enrichment within the test SNP set. This can reveal the sites of action underlying the GWAS signal, and provide confirmation of the validity of the GWAS where a tissue specific mechanism is known or expected for the phenotype. Conversely unknown tissue involvements can also be revealed.
In the initial implementation, the functional elements considered are DNAse1 hotspots from either the ENCODE (Thurman et al, 2012) or Roadmap Epigenomics projects generated by the Hotspot method. The hotspots are regions of general DNase1 sensitivity (rather than peaks which are more similar to DNase hypersensitive sites) and are used because, although the method works with peaks, hotspots reveal more tissue specific signal.
For each set of test SNPs, an overlap analysis is performed against the functional elements from either data source for each cell sample separately (125 samples for ENCODE, 299 for Roadmap), and the number of overlaps is counted. A background distribution of the expected overlap counts for this SNP set is obtained by picking sets of the same number of SNPs as the test SNP set, matched in decile bins for G+C content (GC), minor allele frequency (maf) and distance to the nearest transcription start site (TSS). The matched background sets are then overlapped with the functional elements and the background distribution of overlaps determined. By default 100 matched sets are used, but this can be increased. The enrichment value for the test SNP set is expressed as the standard score (Z score) (x-μ)/σ. Enrichments outside the nominal 99th and 99.9th percentile of the normal distribution (i.e. Z scores of >=2.58 and >= 3.39, respectively) are considered significant. A schematic of the analysis is shown below.
FORGE Analysis Strategy
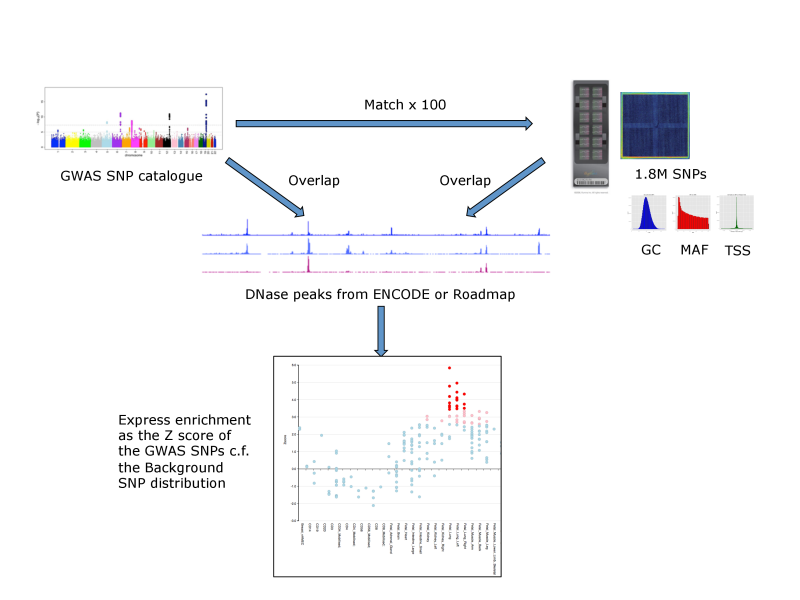
The results are presented by cell sample in either graphic (interactive Dimple chart or static pdf) or tabular (interactive DataTables table or tab separated file) forms. Typical results may show an enrichment of overlap (red or pink points) for the GWAS SNP set in a tissue of mechanistic relevance to the phenotype under analysis, for instance fetal lung tissue and lung cell lines for Pulmonary function SNPs.
Alternatively there may be no enrichment and all points will be blue below the Z score thresholds. This could be because there is no regulatory component underlying the GWAS association, or because the relevant tissue is not present in the available functional element datasets, or for other technical reasons (e.g. too few overlaps or wrong genome build).
A set of example analyses of GWAS studies from the NCBI GWAS catalog [Accessed 07/08/2013] are available in the GWAS catalog examples, and also at http://iandunham.github.io/gallery/.
You can supply a list of SNPs by their dbSNP RefSNP (rs) IDs, one SNP per line in the Paste data: box. For example, you can run the SNPs already in the paste box which are a set of SNPs from GWAS studies on Pulmonary_function (Soler Artigas et al, 2011; Hancock et al, 2010; Repapi et al, 2010) obtained by parsing the NCBI GWAS catalog [Accessed 07/08/2013].
Alternatively you can upload a file from disk or via a URL. The file should contain
- a list of SNPs by RefSNP ID, one per line as above (example rsid format file),
- SNPs in VCF (Variant Call Format) format (example VCF format file),
- SNPs in BED (e.g. Personal Genome SNP format) format, (example BED format file).
In fact any BED format with 3 columns (0 based, chrN) will work e.g.
chr21 31812007 31812008
If you experiment you’ll find that FORGE will also accept chromosome names as just N (Ensembl) and 1-based format where begin and end position are the same. Note that if you provide locations rather than RefSNP IDs they should currently be on build GRCh37 (hg19). RefSNP ids should work independent of genome build. One characteristic result when providing erroneous mappings is apparent depletion of the overlap statistic.
SNPs have to be present in the 1000 genomes phase 1 integrated call data set to work in the analysis. Any SNPs provided not in this set will be excluded from the analysis and this is reported to you. Also note that at least 20 input SNPs are required in the set for the web based analysis. There is no maximum, but very large sets will be slow to analyse. See below for false discovery rate analysis.
Name for this data
Give an optional name for your SNP set. This name will be used in the title of the pdf output image.
Analysis data
The data set to analyse your SNP set against. Currently this is DNase1 hotspots from either the ENCODE (Thurman et al, 2012) or Roadmap Epigenomics projects generated by the Hotspot method. The hotspots are regions of general DNase1 sensitivity (rather than peaks which are more similar to DNase hypersensitive siites) and are used because, although the method works with peaks, it reveals more tissue specific signal with hotspots.
Background selection
Specify whether the background matches should be picked from general set of arrays used in GWAS (GWAS typing arrays) or from the Illumina_HumanOmni2.5 (Omni array SNPs). The GWAS typing arrays include the following arrays as provided by Ensembl:
Affy_GeneChip_100K_Array Affy_GeneChip_500K_Array Affy_SNP6 HumanCNV370-Quadv3 HumanHap300v2 HumanHap550v3.0 Illumina_Cardio_Metabo Illumina_Human1M-duoV3 Illumina_Human660W-quad
In both cases SNPs have to be both present on the arrays AND in the 1000 genomes phase 1 integrated call data set to be included in the background calculation.
Background repetitions
Define the number of matching background SNP sets to analyse for the background overlap distribution. By default this is set to 100 background SNP sets, but larger numbers (e.g. up to 1000) will reduce false positive effects, at the expense of analysis speed.
Significance thresholds
These are the Z score thresholds used to colour the points red (by default >= 3.39) or pink (>=2.58). We estimate false positive rates at around 0.5% and 1-2% at these thresholds, respectively for 20 or more SNPs in the set. Increasing the thresholds will reduce false positive rates as shown in the plot below. Our tests suggest that using values of 3.7 and 2.83 increases stringency but does not alter the qualitative observations on the GWAS catalog phenotypes.</div>
Several outputs are produced and provided from the results page.
- An interactive table of the overlaps by cell is given by default on the results page.
- The PDF link provides a base R graphics pdf chart of the FORGE analysis useful for printing, presentations and publications.
- The Interactive chart link provides an interactive chart to explore the data.
-
- The TSV link provides the FORGE analysis results in tab separated format.
Each of the graphics presents the Z scores by cell sample. Cells are grouped alphabetically by tissue and then organised alphabetically by cell name. In each of the graphics the colouring is consistent, blue (Z < 2.58), pink (2.58 =< Z < 3.39), and red (Z >= 3.39).
See the following graphics/links for examples of the output for the default Pulmonary_function SNPs:
Interactive Chart
The interactive chart presents the Z scores by tissue. Each point is a Z score for a cell type with the different cells organised alphabetically within the tissues. Where the same cell type is assayed (either the same cell line, or the same sample type from different individuals) the results are stacked at the same x axis position which provides useful validation of results where there are replicate or equivalent cell samples. Mouseover the individual points will show a tooltip giving the information from the results table. The fields called Class and Number are for plotting purposes only and should be ignored.
The pdf output presents the Z scores in a similar way organised alphabetically by Tissue and Cell, but without stacking duplicate samples. For guidance the Tissues are divided by the brown vertical lines. Horizontal pink lines show the Z score thresholds. A thumbnail example is shown below but the original is available here. Threshold lines are not necessarily plotted if the results are all below threshold.
 TSV file
The results are also available as a tab separated value file (TSV) with columns as follows:
- Zscore - The Zscore of the test data enrichment count versus the background
- Cell - The cell for which the enrichment is calculated
- Tissue - The tissue of the Cell according to either ENCODE or BioSamples
- File - Filename of the functional annotation analysed
- SNPs - The SNPs that overlap features in that file
- Number - An irrelevant number used to help plotting.
- Accession - The GEO accession number of the data set.
Data
ENCODE consortium hotspots were obtained from ftp://ftp.ebi.ac.uk/pub/databases/ensembl/encode/integration_data_jan2011/byDataType/openchrom/jan2011/combined_hotspots/
Roadmap Epigenome DNAse I sequencing tag alignments were obtained from http://www.genboree.org/EdaccData/Current-Release/experiment-sample/Chromatin_Accessibility/. These were processed by the Hotspot method to give hotspot files using the default parameters.
Cell and Tissue assignments were obtained by custom perl scripts using data from ENCODE Data Coordination Center tables or BioSamples
Overlaps
DNase I hotspot data in bed/wig format was formatted for overlap analysis using Tabix. All SNPs in the 1000 genomes phase 1 integrated call data set were downloaded from ftp://ftp.1000genomes.ebi.ac.uk/vol1/ftp/phase1/analysis_results/integrated_call_sets and overlaps with the DNase I elements by cell type for every SNP were calculated using Tabix in a distributed approach on the EBI compute farm. Overlaps were stored as a binary string for each data set (ENCODE or Roadmap) for each SNP in an indexed sqlite database, forge.db.
FORGE analysis
For a given set of SNPs FORGE queries the sqlite database and retrieves all overlap bit strings. It then unpacks the bitstrings for each SNP and counts the overlaps per cell type. It next identifies matching SNPs based on the GC, maf and TSS distance, and repeats the overlap analysis for each background set. The final step is a simple calculation of the Z score of the test overlap count versus the background distribution.
Outputs
The TSV output is generated by FORGE during processing. The graphic and tabular outputs are all generated via R code embedded in FORGE. The pdf output is generated with base R graphics. The interactive table is produced using the Datatables plug-in for the jQuery Javascript library accessed through the rCharts package. The interactive graphic is a dimple d3 interactive graphic again using the rCharts package.
Estimating False Positive Rates by SNP count in the Test SNP Set
To estimate false positive rates, 1000 randomly chosen SNP sets for each of a series of SNP counts between 10 and 100 SNPs were analysed using FORGE on the Roadmap and ENCODE data. The false positive rate was calculated as the number of cell enrichments greater than the two standard thresholds used by FORGE expressed as the proportion of the total number of cell overlap tests performed (424000).
False Positive Rate by SNP set Count
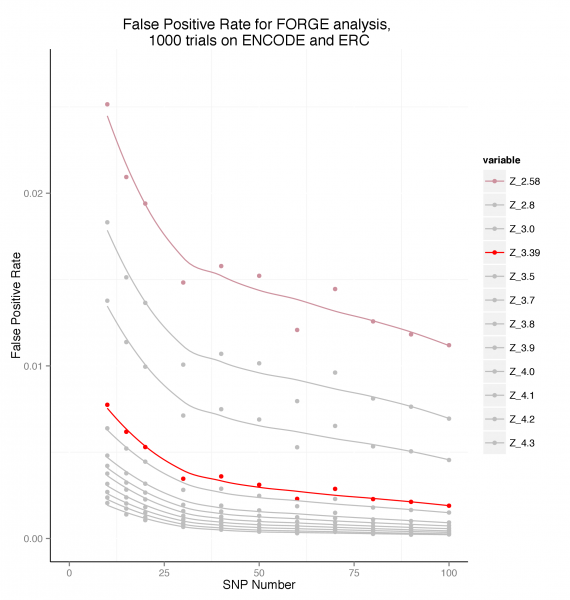
This plot suggests that for a SNP set of >= 20, a threshold of Z >= 3.39 maintains the false positive rate below around 0.005 (0.5%).
The source code for FORGE is available on Github at https://github.com/iandunham/Forge. It has been installed and run on Mac OSX 10.8.4, 10.8.5 and Red Hat Linux. To run you also need to download the Forge.db database and background selection hash tables from
ftp://ftp.1000genomes.ebi.ac.uk/vol1/ftp/technical/browser/forge.
If you find the tool useful, please cite the website at http://browser.1000genomes.org/Homo_sapiens/UserData/Forge. For use in publications cite the website and Dunham, I., Kulesha, E., Morganella, S. & Birney, E. FORGE : A tool to discover cell specific enrichments of GWAS associated SNPs in regulatory regions. (Manuscript submitted).
Ian Dunham (dunham@ebi.ac.uk)
Acknowledgements
Thanks to Jan Quell for initial implementation of the pdf graphic and to Ramnath Vaidyanathan and @timelyportfolio for assistance with rCharts. We thank Prof Ajay Shah and Marc-Philip Hitz for comments on the results of cardiac phenotypes, and Graham Ritchie, Valentina Iotchkova and Nicole Soranzo for discussions.